Latest Articles

Google will shut down Analytics for Mobile Apps in 2019

If you’re tracking and collecting data from your app with the help of Google Analytics (GA) for Mobile Apps, you definitely want to read this.

Google recently announced that, as of October 2019, it will progressively sunset the collection, processing and reporting of data for its GA for mobile apps. This means that if you are using the free version of GA and their services SDK, you’ll be invited to migrate to the Firebase Analytics platform. This Google’s integrated app developer platform is now being brought forward as the only solution to collect data from your app (Android or iOS).

This also means that as of October 31, 2019 data collection and processing for properties using the GA services SDK will stop. Furthermore, historical data will be removed from Google servers as of January 31, 2020.

What’s the next step?

First of all, if you are using Google Analytics 360, you are not impacted, as there is currently no plan on shutting down the service for GA360.

If you are using the free version of Google Analytics however, you should consider migrating to Firebase Analytics or go for an alternative tool (stay tuned for our next article on the subject). To migrate to Firebase, the following process should be followed:


1. Create a Firebase project in the Firebase console

  2018Charlie Firebase

You can have multiple apps (for example iOS and Android version of your app) in the same project.

2. Install the Firebase SDK on your app (Android or iOS)

3. Add Firebase Analytics to your app.

On top of this, if you wish to configure additional Google (such as floodlights) and 3rd party tags (such as sales pixels), you should add Tag Manager to your Firebase-enabled app.

It is important to know that there is no possibility of ensuring continuity of data collection if you do not migrate your current implementation. If you already had a robust Category/Action/Label event hierarchy setup, Google recommends to rethink and apply your implementation structure into the new methodology applicable in Firebase.

What we think about this

It is no surprise to hear this announcement as Google has been investing a lot of resources into the new Firebase platform, making it more intuitive and user-friendly. Developments for app measurement in Google Analytics have been stopped for quite some time now. The goal here is to have a clear split between Google Analytics, oriented towards website analytics and Firebase, the platform for mobile app tracking and analysis. This makes sense as behavior on a website is very different than on mobile and it’s therefore easier to create mobile-specific audience groups for advanced campaign targeting.


However, Firebase is a young platform and still has some room for improvement. It is for example not possible to create more than 25 custom parameters in data collection, compared to the 200 provided by GA360. We hope that Firebase will fix these kind of limitations progressively, especially if they want to offer their Firebase solution as the sole tool for app tracking.

{snippet charliedeschamps-en}

3 optimizations to rank your app higher in the Google Store

Mobile phones evolved in such a way that today we’ve become completely dependent on applications. Some might be for checking your destination while taking into the traffic others might inform you about today’s weather predictions. Their usage increases exponentially and the number of apps available also follow the same trend.
That’s one of the reasons why it has become so important to optimise your application within the respective app stores. This field of focus is called Application Search Optimisation (ASO).
 
In the case of the Google store, there are different attributes that you should take into account in order to increase the brand awareness and downloads. In this article will only tackle the three key elements that you should focus on if you want to increase your ranking. With regards to the iOS app, the approach of store optimization is also based on keywords. The difference lays in the attributes you have to use in order the improve the ranking of your app.
 

Key segments for ranking your Android app

 1. Title

Similar to the reasoning in the Apple (iTunes) store, the app title plays an important role within the store optimization of the Google Play store. Different ways to display the title exist. You can choose which one you prefer depending on the element you want to put first (Name vs. USP).
  • Name of the app - USP
  • Name of the app - USP
  • UPS - Name of the app
  • UPS: Name of the app

Title Article 1 - ASO - EN

2. Short description

The short description within the Google Play store impacts the optimization of the applications according to keywords integrated. Up to 80 characters can be included within this short description. This means the focus should be on the primary USP of the app. Keywords used in the short description directly influence the findability and ASO of the app. It is important to note here that while keyword ranking can lead to higher overall positioning, the description should in the first place be written from a customer-centric point of view. Thus, being attractive to the consumer in order to spark a conversion.

Short Description Android Article 1 - ASO - EN

As mentioned, it is recommended to put forward a USP of the app. For instance in the case of Castle Crush they focused on two main USPs: Free and Strategy game. In terms of other optimizations, continuous keyword analysis and competition watch could identify new and trending keywords to be integrated.

3. Long description

In comparison to the Apple App store, the description used in the Google play store is an essential element from an app store optimization point of view and will be indexed by the Google robots. The long description can include up to 4000 characters and can thus be used extensively to strengthen the app store ranking.
 
A well structured description not only makes it easy for these Google robots to understand the function of the app, but additionally allows users to, at a quick glance, read up on the most important advantages of the app.
While there are 4000 characters available, it does not mean that these need to be fully used. Once again, content should be written from a customer perspective. If it is possible to convey all information, using the most important keywords in less than 4000 characters then this is definitely acceptable. For a user point of view. The likelihood of someone reading the full description will be relatively low. Thus, keep the description light and easily navigable.

For example in the case of Fox News, they decided to follow the following structure:

  • The mains advantages from utility point of view;
  • The Features of the app;
  • Reputation and additional features;
  • Topics covered by the app;
  • Call-to-Action message;

Long Description Article 1 EN

It is important to point out that in this example, each UPS occurs in the text at least twice.

Recap - Google play store

Recap Table Article 1 EN - ASO

Of course there are other elements that could be taken into account but we just wanted to tackle the key elements.

{snippet placidemugenzi-fr}


An Introduction to Customer Data Platforms (CDP’s)

It is not just a trend anymore. Modern marketers should make informed decisions by consulting data. Even though most companies nowadays own tons of data, only few leverage it to benefit their business goals. The problem lies in the fact that our data is fragmented in different silos. We have online website data, email data, advertising data, offline CRM & data warehouse data, you name it. But none of these sources speak to each other, they mainly exist on their own. What we should be striving for is data centralization in order to get a more unified view of our customers. Only than we can fully speak about defining relevant customer journeys. But how do we work towards this perfection? We need to leverage the existing technologies of today’s market, more specifically Customer Data Platforms (CDP’s). CDP is currently a $300 million industry and projected to reach $1 billion by 2019.

If you want to be ahead of trends 2019 will be the year that you better jump on the bandwagon. With this in mind Semetis is preparing a series of articles around the topic, so stay tuned for more.

What is a CDP?

Let’s re-use the Wikipedia definition for a minute:

“A Customer Data Platform is a marketer-based management system. It creates a persistent, unified customer database that is accessible to other systems. Data is pulled from multiple sources, cleaned and combined to create a single customer profile. This structured data is then made available to other marketing systems. A CDP provides real-time segmentation for personalized marketing.”

So in short the aim of the CDP is to bring together all your data pools and to stitch that data together into unified customer profiles. That way a marketer can easily work with it. The end goal is in-depth marketing personalisation. It is all about sending the right message at the right user wherever in their customer journey. This can go beyond digital and include offline customer journey touchpoints.

So how does this differ from CRM & DMP ?

It’s not the intent of this article to give a full explanation around each of these buzzwords. The purpose is to give you in short the main differences.

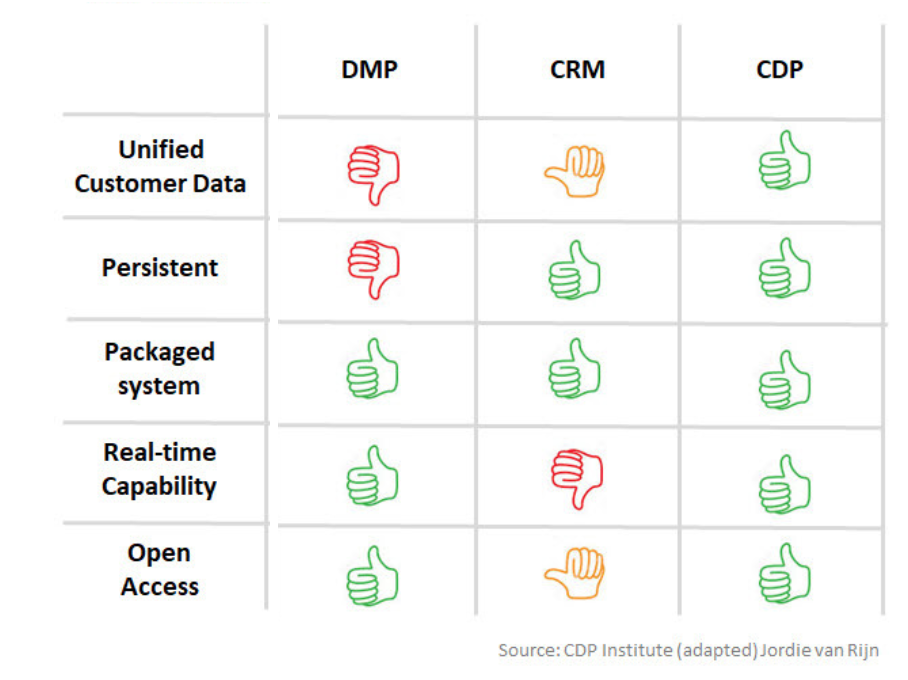
1) Differences with CRM

CRM systems are built to engage with customers, on the basis of historical and general customer data to create a persistent customer profile. They lack the ability of plugging in other data sources. A CDP on the other hand is able to connect all types and sources of customer data, often varying between internal - or external data, and structured - or unstructured data.

Thanks to this functionality we get a more holistic view of our customers which enables us to better understand them and act in real-time. In short a CRM is only one specific data source that can be fetched into a CDP.

Typical CRM data corresponds to the average membership card - and profile data, like phone, address, email and permission data. But it might also includes information from web forms and surveys. The CDP is built to handle any type of customer data. As the tool is flexible in adding or changing data sources, it functions rather as a central repository of your users.

2) Differences with DMP

It is easy to confuse a Data Management Platform with a CDP. DMPs were mainly designed to serve advertisement and enable retargeting using cookies. The focus is less on single customers and more on clustered segments and categories. In a DMP, much of the info is anonymous and typically expires after x-amount of days (being the cookie lifetime).

The CDP creates a persistent customer profile. That means it stores the data and keeps the history. All this data combined gives us the single user view we crave for. So in brief: DMPs were designed to retarget anonymous users for advertising, whereas CDPs create a database of your identified customers to go out of the scope of only advertising (but still include it).

CDP Matrix

More concretely, why would you need a CDP ?

In short a CDP can help you to answer the questions in the list below. If you recognize questions that are often asked within your company, then a CDP could be a solution to look into.

  • Should we retarget this user or did he already make the purchase in one of our physical offline stores?
  • What products can we offer the user for cross-sell in regards to both his online and offline purchases?
  • What was the product this customer bought before their latest purchase?
  • Which segments / target groups does this customer belong to?
  • What is the likeliness of this customer to churn?
  • What products/categories has the user shown interest in lately? Can we detect his/her favourite product?
  • What is their purchase intent?
  • What is the customer lifetime value (CLV) of this customer?
  • Through which media/channels do they preferably interact ?
  • What are their preferences and where are they in the customer journey?
Obviously this list is non-exhaustive but it gives you a first more tangible idea of the answers that a CDP can provide. Once more it is all designed to send the right message to the right user regardless of behaviour within the customer journey. Only when we see the full picture we will be able to push customers away from churn behaviour and to increase their CLV.

Conclusion

Customer Data Platforms are already a big hype in 2018 but will gain more importance in 2019. This article prepared you with the basics by explaining what they are and how they differ from CRM & DMPs. Summarized in one key take-away it’s all about building towards a user-centric view. How could you tackle this? 1) Think structurally about your business omnichannel challenges, as every company is different. 2) Focus on your first-party data as it never gets fully leveraged. 3) Use the technology that is available on today’s market to bridge the current gaps in your customers’ journey.

{snippet fredericpalella-en}

Why Google leads Omnichannel Measurement ?

The launch of the Store Visits in Google Analytics

Big News! You might have heard it. Recently Google released a new beta feature: “Store Visits” for Google Analytics. What is it? Long story short, it allows to measure the link between website sessions and in-store visits.

How does it work from a technical point of view ? Google uses 3 streams of data. First they link sessions with users that are logged in any of the Google properties (YouTube, Gmail, etc.). Secondly with the linking of Google My Business - AdWords - Analytics, Google has access to every store’s address that belongs to an advertiser. Finally users share their location settings with Google. Those location data connected with very accurate measurement based on Wifi signals, GPS signals and other technologies allow Google to make sure that users have been in a store and didn’t just passed by. By connecting the 3 streams of data they can tell if a user first visited a website and then went in a shop. Obviously Google can’t measure this for every users. They do it for a large enough base of users and then extrapolate to the entire population with an accurate confidence interval.

On the screenshot below you can see how the report looks like in Google Analytics:


This new feature arrives in the context of heavy discussions on omnichannel and a few months after the release of two other features that also aim to link the online & offline world:

  • The Store Visits (SV) in AdWords
  • The Store Sales Direct (SSD) in AdWords

A few months ago we wrote another article explaining all the details on how Store Visits and Store Sales Direct were measured for Google AdWords.

What’s the difference between all of those ?

Well first, Store Visits only measures visits and don’t require any data to be sent from the advertisers while Store Sales Direct measures the link between clicks and effective sales and revenue generated in store. This second feature obviously requires advertisers to send specific data about users and in-shop sales behaviors in order for Google to do the matching.

Secondly, the main difference between SV in AdWords and in Google Analytics is that SV in AdWords are based on clicks while based on sessions in Google Analytics. More importantly, SV in Google Analytics allow to make the link between every source of traffic and in-store visits while AdWords only makes the link between a click on an AdWords ad and in-store visits.

This last element is the big news of the week. Indeed so far it was possible to measure links between in-store visits and advertising platforms such as Google, Facebook, Bing. Nevertheless, by summing up all the store visits that each platform attributes to its campaigns we were ending up with much more store visits compared to what really happened from a business point of view.

That situation was due to attribution. Indeed each of those platforms use a post clicks/views attribution model with cookie delays of several days. The good news with the store visits in Google Analytics is that it:

  • Homogenizes the measurement cross platforms
  • Deduplicates the store visits conversions between the platforms
  • Allows to have a closer picture of what really happened from a business point of view

And again, that’s the main purpose. We want to make sure we do things that impact the business and drive more sales/revenue.

Note that Google Analytics’ measurement has its limitations too. Indeed Google Analytics attributes by default store visits with a last click attribution model. This means that only the last interaction of a user will get all the credits. Moreover it’s sessions based measurement. This means we miss the whole impact of impressions and views !

However, with the release of this feature, Google is positioned very strongly in the omnichannel measurement dimension. They took more time than others to react on it but 2018 has already been definitely the year of the omnichannel measurement. This positioning makes sense at a time where most advertisers try to bridge the impact of online advertising on offline sales/revenue. Being able to understand how online influences offline through concrete data will definitely help convincing the one that did not consider it yet.

What’s next ?

This measurement is a strong plus in Google’s strategy as they take a central piece in the omnichannel measurement. Nevertheless, as explained above, the way Store Visits are measured today in Google Analytics has its limits. Consequently here are a few things we could expect in the coming months/years:

  • The possibility to play with different attribution model for SV measurements
  • The possibility to apply the data-driven attribution model (only valid model)
  • The measurement of store visits based on impressions/views
  • Integrating smart bidding options on store visits measurement

Finally here is an assumption, you probably all remember that Google tried to launch Google Attribution beginning of 2018 before stepping back. The main reason was the tool was not ready. My 2 cents opinion: Google Attribution had low added value compared to already existing solutions in Google Analytics. Nevertheless, integrating the whole omnichannel measurement approach within an updated version of Google Attribution would dramatically increase the added value of the tool. Could this be the main next step, probably in 2019 ? Let’s see in the months to come.

{snippet juliendevisscher-en}

Subcategories

Semetis Icon