Introduction
Over the last couple of years we have been hearing a lot about 2 important challenges:
- The big switch in Internet device consumption
- The challenge of integrating online & offline environment
Actually, those two challenges have never been so close to each other. In fact,they both feed on each other. In July 2017, mobile devices in Belgium represented 44,1% of the total Internet consumption versus 44,7% for desktop (source: http://howwebrowse.be/). Several studies have shown the close relation between mobile consumption and shopping in brick-and-mortar shops.
For retailers & e-commerce, being able to capture the real value and impact of mobile advertising has always been a big challenge. From a performance point of view, mobile advertising is currently less interesting: less conversion volumes, lower conversion rates and higher cost-per-acquisitions. This challenge became progressively harder as mobile consumption kept increasing while value measurement remained unclear. A few years ago, Google AdWords started integrating cross-device conversions. Which was a first step towards a better measurement of mobile efforts. The metric helped capturing the assisting role of mobile advertising in the conversation paths. It brought interesting insights but also a lot of questions on the accuracy of this metric. Today cross-device conversions have been integrated in Google AdWords’ data driven attribution model, which helps better understand the value of each touch points in the overall consumer journey.
Aside from measuring the impact of mobile on online purchases, the main technological actors: Google, Facebook and Waze have been looking into linking online advertising and offline store visits and purchases. This link between online & offline is not mobile specific but by experience we have been able to observe that the biggest impact was coming from mobile. Both Google & Facebook have been working on two main features that are already available, in beta (or planned) for the coming weeks/months (in the Belgian market). Those two features are the following:
- Store Visits – the goal is to measure the impact of online advertising on the number of visits in brick-and-mortar shops
- Store Sales (or Offline Conversions) – the goal is to measure the impact of online advertising on the revenue that is generated in the brick-and-mortar shops
Store Visits
What is it ?
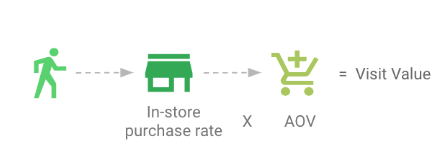
On both Facebook and Google platforms, store visits conversions have the objective of linking the user who clicked/saw an ad and then went in a brick-and-mortar shop. Store visits is a measure of the number of visits in the shops and not a measure of the revenue generated in-store. Nevertheless, by using a simple formula, we can easily extrapolate the data to estimate a total revenue generated:
 How does it work ?
Calculating Store visits is as simple as this:
- A consumer signed-in and opted-in to location history clicks or viewed an ad
- This consumer then visits a store within a defined period of time
- A store visit is reported, aggregated and anonymized
From a technical point of view, both platforms use GPS, Wifi triangulation, geometry, Wifi scanning and location history to define whether or not a consumer is going in-store. Note that within a certain interval of confidence, the data are extrapolated for the population. Finally in terms of accuracy, thanks to all tracked data, measurement is as accurate as 1 meter. It is consequently good enough to make the difference between someone who is hanging around your store, or inside your store.
From a pure operational point of view, the store visits will be reported as a new metric in the reports (both on Facebook and Google side).
How can we set this up ?
Setup is relatively straight forward if you are well prepared. The process is slightly different on the two platforms:
Google:
- You need to have a well set-up Google My Business (GMB) account with all your locations
- All those locations need to be “verified” by Google
- Your GMB and AdWords accounts need to be linked
- Your Google account manager needs to activate the feature within the platform
Facebook:
- You need to set-up your Facebook Business location structure directly within the platform
- Get the feature activated through a Facebook account manager
Is it already available ?
Facebook:
It’s currently in closed beta. If you want to activate it, it needs to be discussed with your account manager
Google:
The feature will be available in first quarter 2018 (in Belgium). It’s already available in other markets: France, UK, USA, etc.
Store Sales (or Offline Conversions)
What is it ?
On both Facebook and Google platforms, store sales (according to Google) or offline conversions (according to Facebook) have the objective of linking the user who clicked/saw an ad and then made a transaction in a shop. The big difference with store visits liaise in the fact that it looks at transaction data.
How does it work ?
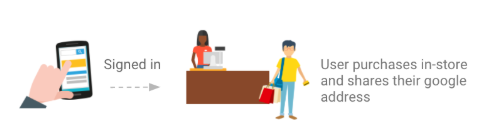
- A logged-in user clicks on an ad
- This user visits the store and provides his/her email (and/or other personal informations) at purchase
- Advertiser can upload their hashed email with all transactions informations via the platforms (Google & Facebook)
- Store sales/Offline conversions match logged-in user emails with advertiser’s sale data
Note that within a certain interval of confidence, the data are extrapolated for the population.
The biggest element to verify before sending information to Google and/or Facebook is the legal aspect. We consequently always recommend to first discuss this with the legal department. Nevertheless, both Google & Facebook have very clear policies regarding those elements.
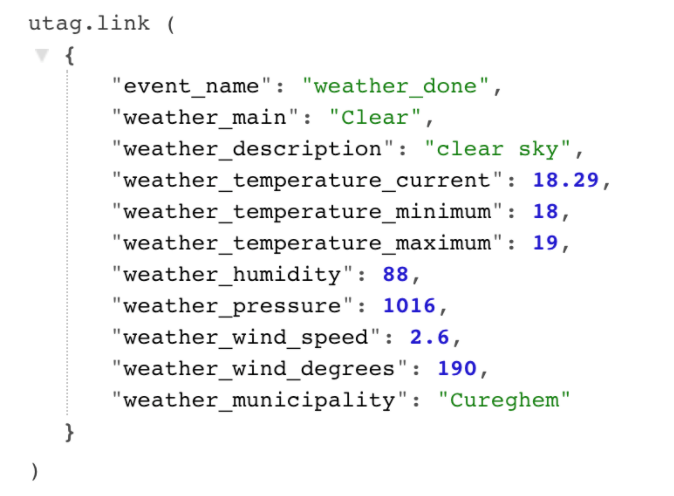
Here below, you can see an example of the kind of informations/documents you need to be able to provide for the upload within the platforms

How can we set this up ?
Like Store visits, the setup is straightforward if you are well prepared:
Google:
- Build the file containing the required informations according to the guidelines
- Upload the file within the Google platform
Facebook:
- You need to set-up your Facebook Business location structure
- You need to create within the platform an offline event and assign it to your campaigns
- Build the file containing the offline events
- Upload the file within the platform either manually or through the API
Is it already available ?
Facebook:
Yes it is available
Google:
The feature will be available end August/beginning September 2017
Conclusion
For some of our clients (active in France) we’ve already been able to activate most of the features. Results were surprising as it has really helped us understand the value of the investments we were doing on mobile. Indeed, mobile was by far the device which the lowest cost-per-store visits and cost-per-store sales/offline conversions.
In the introduction we were making a reference to the retailers and e-Commerce businesses. Actually, we know that store visits and store sales/offline conversions will have a massive impact on all advertisers that have brick-and-mortar shops. Automotive will be able to report on cars sale. Telco will be able to report on the link between online investments and in-store bought abonnements. The list is long as those features will have a massive impact on the way we currently assess the value and impact of online advertising as a whole and online mobile advertising specifically. {snippet juliendevisscher-en}
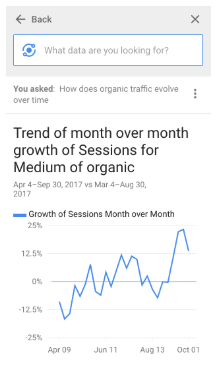
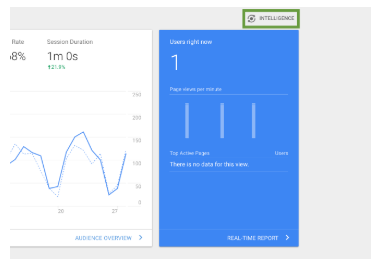 Clicking the Intelligence icon will open up a pane on the right hand side.
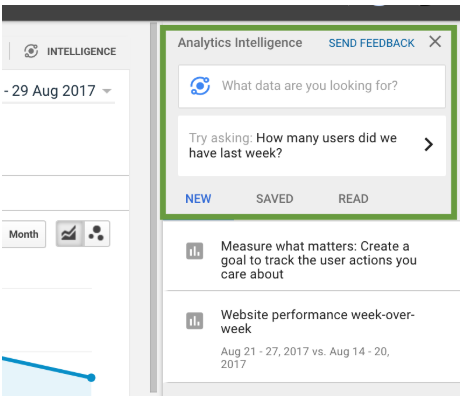
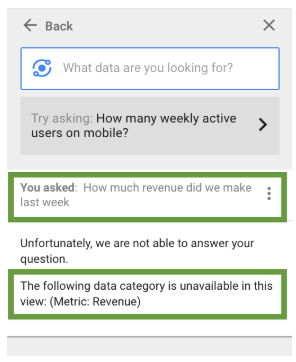
 Limitations


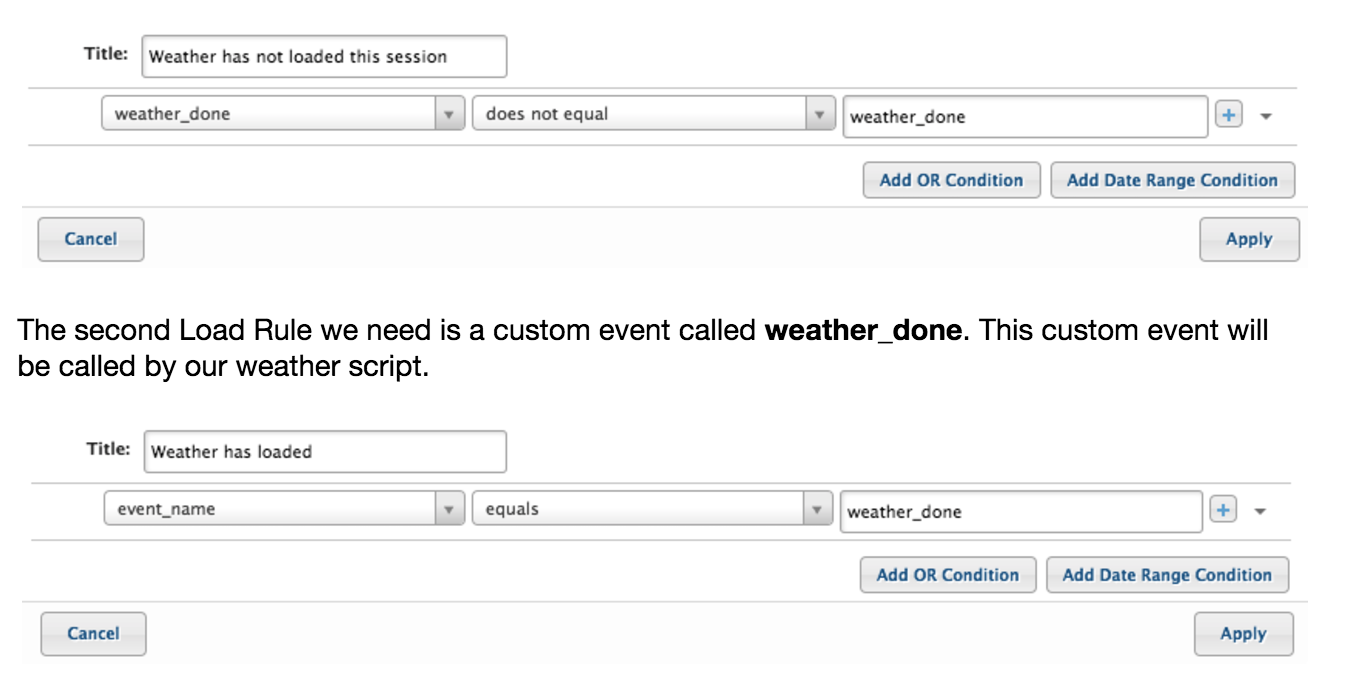
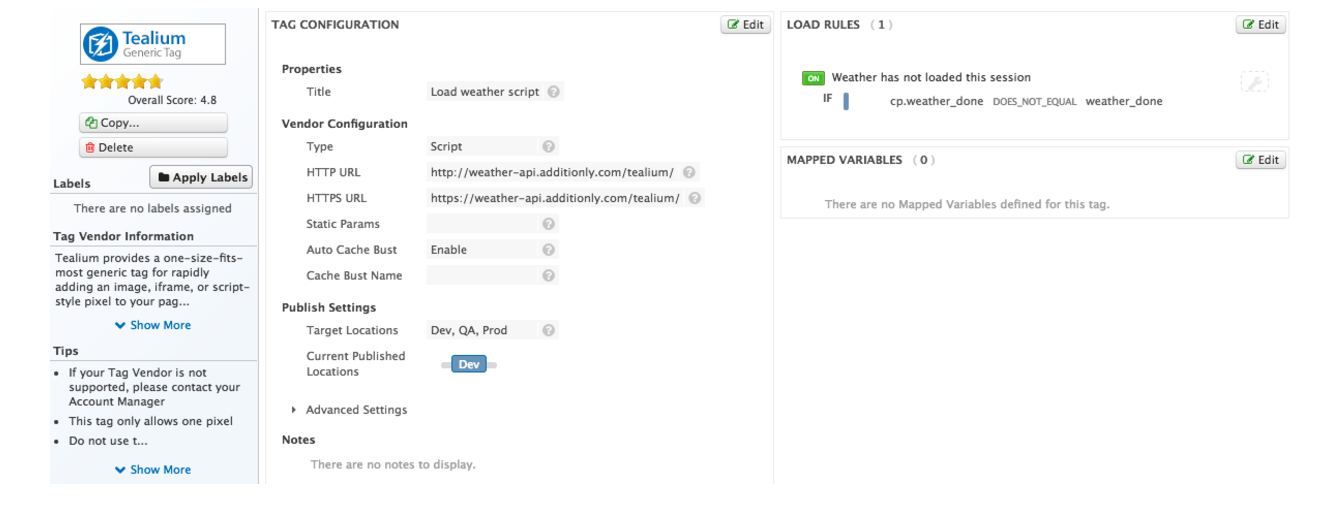
 Load Rules